
DFW Rental Market Deep Dive | Garland
- Jan 23
- 2 min read
Updated: Apr 10
We continue our DFW rental market deep dive series with a neighboring city: Garland, TX. Known for its strong manufacturing base (including being the cowboy hat capital of the world with brands like Resistol), diverse population, affordable living, and proximity to downtown Dallas, Garland is attractive to homeowners, renters, and investment property owners in the residential space.
We'll take a look at a few key data points for Garland, namely, pricing, rents, and economic factors. So let's dive right in!
Pricing & Rents
Rental pricing for homes in Garland reflects a resilient market with moderate growth thus far in 2026. For all five main Garland zip codes (75040, 75041, 75042, 75043, and 75044) Zillow data as of January 2026 shows an average rent of $2,050 with a range from $475 to $21,500 depending on size and amenities. This represents a year-over-year increase of $150 (8%), though month-over-month figures were flat to slightly up in some areas.
Average Rent Price Over Time - Garland (75040) - Houses Only
Average rent: $2,175, UP $75 (4%) month-over-month, and up $180 (9%) year-over-year
Current rental supply: 81 houses
Average days on market: 60

Average Rent Price Over Time - Garland (75041) - Houses Only
Average rent: $1,950, down $49 (2%) month-over-month, and down $45(2%) year-over-year
Current rental supply: 24 houses
Average days on market: 100

Average Rent Price Over Time - Garland (75042) - Houses Only
Average rent: $2,000, down $95 (5%) month-over-month, and down $130 (6%) year-over-year
Current rental supply: 22 houses
Average days on market: 72

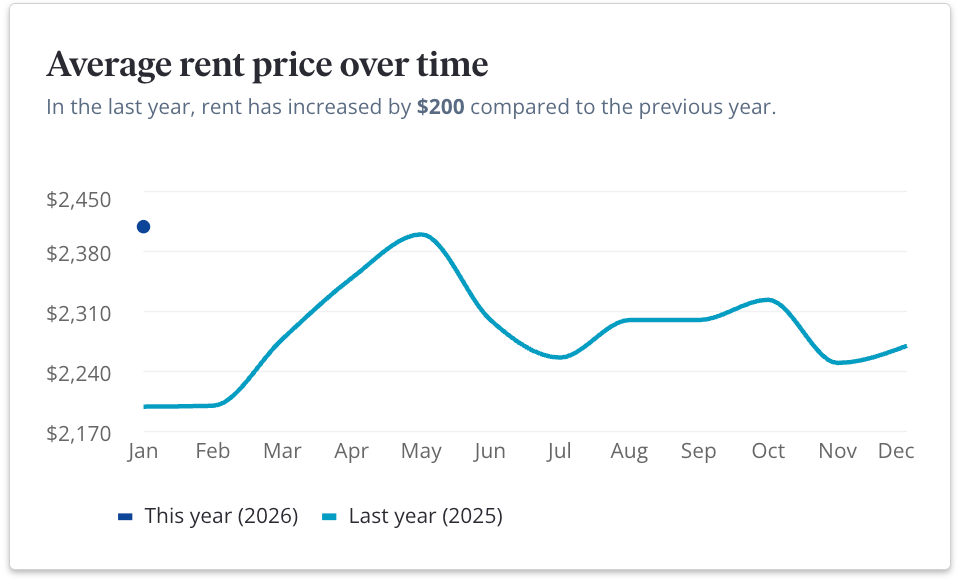
Average Rent Price Over Time - Garland (75043) - Houses Only
Average rent: $2,400, up $5 (0.2%) month-over-month, and up $200 (9%) year-over-year
Current rental supply: 113 houses
Average days on market: 75
Average Rent Price Over Time - Garland (75044) - Houses Only
Average rent: $2,500, up $100 (4%) month-over-month, and up $60 (2%) year-over-year
Current rental supply: 45 houses
Average days on market: 78

Additional Key Insights: Market Drivers, Inventory, and Strategic Recommendations
Garland's population is estimated at around 250,431, with a median household income around $74,717—above national averages—supporting purchasing power and rental affordability.
Low unemployment at 3.9% and proximity to major DFW employers (including manufacturing and logistics hubs) drive consistent demand.
Inventory has increased modestly (e.g., 35% year-over-year in some reports), leading to longer days on market and more balanced conditions. This favors buyers and renters but maintains seller pricing power in desirable areas.
Future Outlook
With DFW rent growth forecasted at 3% in 2026 and stabilizing supply, Garland remains attractive.
Ready to know what your DFW rental is worth?
Get a free rental analysis from our team — no obligation, no pressure. We’ll tell you exactly what your property should rent for in today’s North Texas market.
Darling Property Management


Comments